Showing posts with label Debug. Show all posts

Wednesday, June 22, 2011

Silverlight Debug Helper (Visual Studio Add-in)

If you are actively using my debug helper Add-in for Visual Studio which I released last fall, you may be pleased to learn that I've uploaded a new version. And if you're not using it yet, I invite you to take a look at it.
The tool has been renamed to "Silverlight Debug Helper" (formerly "Firefox Debug Helper") because I added support for Chrome and Internet Explorer to it. If you have the previous version installed, you may want to uninstall it first.
From now on, the Debug Helper can be found on this static page (also linked to in the menu at the right), so you don't have to dig through old blog posts to find the download links and description anymore. Let me know what you think, and happy debugging :-).

Read more: Mister Goodcat

Sunday, June 19, 2011

Help yourself in Debugging by using Call Stack and Immediate Window

Here I am going to show you the two important window of the Visual Studio which is useful when you debugging the project and to get the result on the fly during debug mode.


Call Stack Window
Most of the developer get confuse when they are debugging application “From which function call came from up to my debug point”, this happens when they are working the code design by some one else or debugging code of the dll.
Following is one common scenario which I notice number of time developer does.
In the three tier application developers always put the break point in presentation layer when the break point get hit they always check the data and the do wonder that which business layer method called >> database layer method get called by presentation layer to get this data.
The Solution is Call Stack Window which is part of the Visual Studio. Shortcut for it is
Ctrl + Alt + C or go to menu Debug >> Windows >> Call Stack

menu+for+call+window.png

Read more: Daily .Net Tips

Updating .NET String in memory with Windbg

In this post I would show a simple trick to update .NET strings in memory with Windbg. The caveat is make sure the string that you’re updating is long enough to fit into the string buffer. If not there would be a memory corruption.
Here is a simple windows form application with title “Good”
The goal is to update the title from “Good” to “Bad”.

button1.Click += (s,b) => Text = _caption;

I am updating the title in the button click.
Here is the actual string object within the debugger

0:006> !do 0294d0a0
Name:        System.String
MethodTable: 59b9fb64
EEClass:     598d8bb0
Size:        22(0x16) bytes
File:        C:\Windows\Microsoft.Net\assembly\GAC_32\mscorlib\
v4.0_4.0.0.0__b77a5c561934e089\mscorlib.dll
String:      Good
Fields:
      MT    Field   Offset                 Type VT     Attr    Value Name
59ba2b30  40000ed        4         System.Int32  1 instance        4 m_stringLength
59ba1f80  40000ee        8          System.Char  1 instance       47 m_firstChar
59b9fb64  40000ef        8        System.String  0   shared   static Empty
    >> Domain:Value  004b0308:02941228 <<

I would be using the e  command to update the memory. The ezu command is used for updating  Null-terminated Unicode string .

Read more: Naveen's Blog

Thursday, June 16, 2011

Debugging Install Functions in Visual Studio 2010

Most of us have probably used or know of the System.Diagnostics.Debugger.Break(). For more information on Debugger.Break checkout this link http://msdn.microsoft.com/en-us/library/system.diagnostics.debugger.break.aspx
Online documentation states that if no debugger is already attached, user would be prompted to attach one to executing program when the break is hit. For some reason however, this didn’t work for us when our desired breakpoint was in an OnInstall() function of an installer class.

Further digging revealed that the comments decorating the Break() call differ a bit from the online documentation:
// Summary:
// Signals a breakpoint to an attached debugger.
//
// Exceptions:
//   System.Security.SecurityException:
//     The System.Security.Permissions.UIPermission is not set to break into the
//     debugger.
[SecuritySafeCritical]
public static void Break();
Apparently, Break() only signals a breakpoint to an attached debugger as per the summary above.


Read more: Sam Abraham

Monday, June 06, 2011

Having Fun with WinDBG

I’ve been spending lots of quality time with WinDBG and the rest of the Windows Debugging Tools, and ran into something I thought was fun to do.

For the sake of keeping it simple, let’s say I have a sample console application that looks like this:

using System;
using System.Collections.Generic;
using System.Linq;
using System.Text;
using System.Runtime.CompilerServices;
class Program {
  static void Main(string[] args) {
    Program p = new Program();
    for ( int i = 0; i < 10; i++ ) {
      p.RunTest("Test Run No. " + i, i);
    }
  }
  [MethodImpl(MethodImplOptions.NoInlining)]
  public void RunTest(String msg, int executionNumber) {
    Console.WriteLine("Executing test");
  }
}

Now, imagine I’m debugging such an application and I’d like to figure out what is passed as parameters to the RunTest() method, seeing as how the application doesn’t actually print those values directly. This seems contrived, but a classic case just like this one is a method that throws an ArgumentException because of a bad parameter input but the exception message doesn’t specify what the parameter value itself was.

For the purposes of this post, I’ll be compiling using release x86 as the target and running on 32-bit Windows. Now, let’s start a debug session on this sample application. Right after running it in the debugger, it will break right at the unmanaged entry point:


Microsoft (R) Windows Debugger Version 6.11.0001.404 X86
Copyright (c) Microsoft Corporation. All rights reserved.
CommandLine: .\DbgTest.exe
Symbol search path is: *** Invalid ***
****************************************************************************
* Symbol loading may be unreliable without a symbol search path.           *
* Use .symfix to have the debugger choose a symbol path.                   *
* After setting your symbol path, use .reload to refresh symbol locations. *
****************************************************************************
Executable search path is:
ModLoad: 012f0000 012f8000   DbgTest.exe
ModLoad: 777f0000 77917000   ntdll.dll
ModLoad: 73cf0000 73d3a000   C:\Windows\system32\mscoree.dll
ModLoad: 77970000 77a4c000   C:\Windows\system32\KERNEL32.dll
(f9c.d94): Break instruction exception - code 80000003 (first chance)
eax=00000000 ebx=00000000 ecx=001cf478 edx=77855e74 esi=fffffffe edi=7783c19e
eip=77838b2e esp=001cf490 ebp=001cf4c0 iopl=0         nv up ei pl zr na pe nc
cs=001b  ss=0023  ds=0023  es=0023  fs=003b  gs=0000             efl=00000246
*** ERROR: Symbol file could not be found.  Defaulted to export symbols for ntdll.dll -
ntdll!DbgBreakPoint:
77838b2e cc              int     3


Read more: Winterdom

Monday, May 30, 2011

How to prevent ILDASM from disassembling my .NET code

Long story short – you can use SuppressIldasmAttribute attribute. However, please note that it won’t prevent decompilers (such as .NET Reflector, ILSpy or JustDecompile) from reverse engineering your code.

Here are the details:

What is IL?

Intermediate Language (IL) is CPU-independent instructions and any managed (.NET) code is compiled into IL during compile time. This IL code then compiles into CPU-specific code during runtime, mostly by Just InTime (JIT) compiler.

What is ILDASM?

ILDASM is a tool installed by Visual Studio or .NET SDK and it takes a managed DLL or EXE and produces the IL code which is human readeble clear text.
How to get IL code from an assembly
For example, consider the following code:

using System;
using System.Text;
namespace HelloWorld
{
    class Program
    {
        static void Main(string[] args)
        {
            Console.WriteLine("Hello world...");
        }
    }
}

Put this code in a console project and build it, you will have an EXE file.

Wednesday, May 25, 2011

Debugging Data Bindings in a WPF or Silverlight Application

The WPF and Silverlight platforms use late bound data binding resolution for bindings in XAML files. This feature allows a DataContext to be set at run-time and the objects within that DataContext to resolve their property bindings then. This late binding enables cool features like DataTemplates, composable applications and run-time loading of loose XAML.

A side effect of late bound binding resolution that can cause developers some minor frustration is that their controls do not display the expected data at run-time.
This article will explain troubleshooting techniques that can help you locate and correct the problem.

Data Binding Overview
Data binding is fundamental to WPF and Silverlight. You will struggle with your application designs, coding and troubleshooting until you understand data binding in these platforms.
The best data binding resource available is the MSDN Data Binding Overview topic. If you have not read or don't fully understand the material in this topic, please take the required amount of time to learn this material.

Ounce of Prevention is Worth a Pound of Cure
Visual Studio 2010 has great tooling to wire up data bindings and checked them at design-time. Please read this article: How to Enable Using the Binding Builder in WPF and Silverlight Applications.
Visual Studio 2010 has excellent design-time sample data support. If you use design-time sample data, you'll immediately see controls that don't have expected data values at design-time.
For a detailed examination of sample data in the WPF and Silverlight Designer for Visual Studio 2010, please read this article: Sample Data in the WPF and Silverlight Designer.

Troubleshooting List
Verify that DataContext is set in either XAML or code
Run the application and view the output in the Debug Output Window
For WPF applications you can increase or decrease the amount of information displayed in the Debug Output Window by changing the WPF Trace Settings, Data Binding value
Name the control that has DataContext assigned, set a break point in the code, and view the named control's DataContext property in the debugger
If binding to a CLR object, put a breakpoint in the source property getter to see that its actually being queried
Add a converter to a binding, then put a breakpoint in the converter
Verify that DataContext is set in either XAML or Code
This tip is along the lines of, "if the TV won't turn on, check that it's plugged in."
This is important for many reasons, but one is easily overlooked; if a DataContext is null, the Debug Output Window will not display any error messages in Silverlight or in WPF.
In WPF you can use the below PresentationTraceSources on a binding and set the TraceLevel to High to view errors related to a null DataContext.
View the Debug Output Window
If you have the DataContext set, any data bindings within that DataContext that can't be resolved will be listed in the Debug Output Window at run-time.

Tuesday, May 24, 2011

Windows debugging made easy

When it comes to debugging hard-to-diagnose software and operating-system problems, there is no set recipe. Rather debugging is all about "having the right tools and knowing how to use them," advised Microsoft technical fellow Mark Russinovich at the close of the Microsoft TechEd conference, held this week in Atlanta.

Among the highlights of each year's TechEd conference are the technology demonstrations. Smart Microsoft and partner engineers walk attendees through how to use some new technology in a step-by-step process, making it seem easy -- or even fun -- to deploy.

HOW-TO: Solve Windows 7 crashes in minutes
And one of the most popular demonstrations over the past few years has been Russinovich's "Cases of the Unexplained," in which he shows how he and others tracked down hard-to-pinpoint errors in Windows deployments.

Read more: NetworkWorld

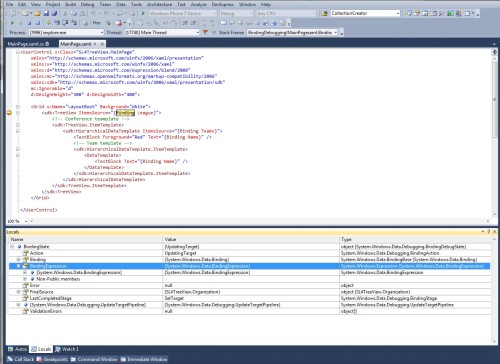
Debugging Data Bindings in XAML with Silverlight 4

Introduction
Yes, you read it correctly, Silverlight 4.
How can I do that?
Simply install the VS2010 SP1 and Silverlight 5 Beta and you get the unexpected bonus of the XAML Parser supporting debugging your data bindings for your Silverlight 4 projects. As SL5 sits nicely in VS2010 SP1 with SL4 it is worth installing the beta just for this feature.

sl4_xaml_binding.jpg?w=500&h=364

I was at the @SLUGUK meeting 18th May 2011, and as Mike Taulty pointed out for other ‘features’, it is difficult to know whether such things as this were introduced by the service pack or the beta as nobody seems to have stopped to check in the rush to get the SL5 beta working

Windbg: putting a break point on managed generic functions

Sometimes its not very straight forward to put breakpoints on generic functions or functions in generic classes. Typing the full class name correctly could be non trivial and frustrating. Here is something which I always follow:

Use method descriptors with bpmd instead. The syntax is !bpmd -md <method descriptor address> . Then the question is how to get the method descriptor address.
Use !dumpdomain – this will list all the modules in all application domains (most applications have only one appdomain).
Take the module name where your type exists and read the module address

!dumpmodule –mt <module address>

This will list the types in the module. Now pick up your types address and

!dumpmt –md <type address>

Read more: Sharing Knowledge

Using Fiddler HTTP Debugger for CRM Troubleshooting and Performance Tuning.

Performance tuning continues to be one of the top requests from customers. When looking at performance from a client side perspective I will often use Fiddler (www.fiddlertool.com) to inspect HTTP traffic as the CRM pages are being loaded. Below is a screenshot that shows what the application looks like and then some of the top features I use.

1538.clip_5F00_image002_5F00_thumb_5F00_758E16E1.jpg

This tool has many features that give you good insight into what is happening during the page load. The data I use most often is:
Total number of requests and request size to pull up a page.

3817.clip_5F00_image003_5F00_thumb_5F00_3FF20B28.png

Thursday, May 19, 2011

Memory Corruption, GC, and Overlapping Objects

Dima has brought to my attention a nasty bug probably attributed to a memory corruption. The bug’s manifestation is usually an access violation in a completely unrelated piece of code, oftentimes causing an ExecutionEngineException.
This is an example of an access violation of the above variety (some of the output was snipped for brevity):

0:004> .loadby sos clr 
0:004> g 
(510.c88): Access violation - code c0000005 (first chance) 
First chance exceptions are reported before any exception handling. 
This exception may be expected and handled. 
00742a11 8b4028          mov     eax,dword ptr [eax+28h] ds:002b:0000002c=???????? 
0:000> !CLRStack 
OS Thread Id: 0xc88 (0) 
Child SP IP       Call Site 
004bedb8 00742a11 OverlappingObjects.Program.Main(System.String[]) [\OverlappingObjects\Program.cs @ 51] 
004beff0 724221bb [GCFrame: 004beff0] 
0:000> k 
ChildEBP RetAddr  
WARNING: Frame IP not in any known module. Following frames may be wrong. 
004bedc4 724221bb 0x742a11 
004bedd4 72444be2 clr!CallDescrWorker+0x33 
004bee50 72444d84 clr!CallDescrWorkerWithHandler+0x8e

Wednesday, May 18, 2011

nDumbster

Project Description
nDumbster is a simple fake SMTP server. 
It allows .Net developers to unit test applications that send email messages by supporting all standard SMTP commands, but, instead of delivering messages to the user it stores then in memory so they can be tested later.

When an instance of nDumbster is created it listens just like an SMTP server, so as long as your application talks via SMTP and you can configure the server connection you can use nDumbster in your testing with no changes to your application code.
nDumbster provides means to fetch messages sent by your code and to check any properties of these messages.

Read more: Codeplex

Enabling debug logging for the Net Logon service

Let me fix it myself
The version of Netlogon.dll that has tracing included is installed by default. To enable debug logging, set the debug flag that you want in the registry and restart the service by using the following steps:
  1. Start the Regedt32 program.
  2. Delete the Reg_SZ value of the following registry entry, create a REG_DWORD value with the same name, and then add the 2080FFFF hexadecimal value.
HKEY_LOCAL_MACHINE\SYSTEM\CurrentControlSet\Services\Netlogon\Parameters\DBFlag
  1. At a command prompt, type net stop netlogon, and then type net start netlogon. This enables debug logging.
  2. To disable debug logging, change the data value to 0x0 in the following registry key:
HKEY_LOCAL_MACHINE\SYSTEM\CurrentControlSet\Services\Netlogon\Parameters\DBFlag
  1. Quit Regedt32.
  2. Stop Net Logon, and then restart Net Logon.
Read more: MS Support

Wednesday, May 11, 2011

Using WinDbg to inspect native dump files

Just a very short instruction on how to inspect native dump files with WinDbg:
  1. Get and install and then start WinDbg
  2. File - Open Crash Dump
~*kb
  1. Lists all the threads and their call stacks.
  2. !locks
Will show you the critical sections. LockCount - RecursionCount - 1 = the amount of times the lock has been acquired.
  1. So if you have several locks that are taken you can check the call stacks and see where you have the deadlock.
  2. !runaway
Will show you time spent in each thread.

I find it useful to get a text dump of all the call stacks which I can search in my text editor, rather than clicking around using Visual studio when searching for a deadlock.

Read more: Jayway Team Blog

Remote Debugging in Visual Studio: Squashing Bugs in their Native Environment

your machine the way you like it, you’ve installed all manner of add-ins into Visual Studio, you’ve added a number of seemingly random assemblies to your global assembly cache. Then, you’re totally disappointed when you copy the executable to another machine and it crashes.

Of course, it’s not really quite like that. Build systems try to ensure that the hidden dependencies are brought to the surface, and large collections of untainted virtual machines allow you to quickly test an application in a clean room environment. Still, it’s impossible to test all possible configurations, and so all too often bugs turn up. In those scenarios, it would be nice get access to the customer’s machine. Using some of the modern support technologies such as NTRsupport, this is fairly easy to do, and by using WinDbg and the SOS Debugging Extension it is possible to install very little on the target machine while still being able to get enough data to diagnose the problem.

Recently, someone pointed out to me that Visual Studio has an alternative for debugging remote applications, which ought to make it a lot easier to debug problems in .NET applications. It would be nice if all that was necessary was to select Debug, Attach to Process in Visual Studio on the host machine, and then enter the name of the target machine.

Of course, it isn’t really quite that easy…

Making the target machine available for remote debugging
Before you can get started, the target machine has to make itself available for remote debugging.
The host machine talks to the target machine via DCOM in order to get the data it needs for debugging the application. The way to set this up is to run the appropriate version of msvsmon.exe, which you can find in the architecture-specific subdirectory:

\program files\microsoft Visual Studio 10.0\Common7\IDE\Remote Debugger

This executable is a DCOM server that handles the requests from remote clients, attaching to the relevant processes and getting data from them.

When the Debugging Monitor is running, it displays a view of the connections as they come in, as shown below. This is useful for debugging connection failures.

Read more: Simple-talk

Debugging Windows Service Startup with Service Isolation

A year and a half ago I touched on the subject of debugging process startup, such as the startup of Windows Services, using the GFlags utility (the ImageFileExecutionOptions registry key).
The general idea is to rely on the Windows loader to launch a debugger instead of the debugged process, and trace your way through the process startup code. Unfortunately, this relies on the debugged process to run in the same session as you—otherwise, you won’t be able to actually see the debugger.

Starting from Windows Vista, Windows services are isolated into a separate session to which you do not have access when you are logged onto the system. The debugger is launched within this session as well, which produces the undesired result of having the service stuck waiting for the debugger, and the debugger stuck waiting for your input which you cannot provide. (To learn more about Session 0 Isolation, check out the trusty Windows 7 Training Kit which covers several application compatibility topics with detailed code examples.)

What can you do to debug service startup on Windows Vista or newer OS versions? All you need is to fire a remote debugging server that debugs the service, and connect to its debugging session from a debugging client. Assuming that your Debugging Tools for Windows installation resides in C:\Debuggers, you can configure the following as the Debugger string in GFlags:

C:\Debuggers\ntsd.exe -server tcp:port=10000 -noio

Tuesday, May 03, 2011

Write your own Debugger to handle Breakpoints

Introduction
Building your very own debugger is a great way to understand workings of a commercially available debugger. In this article, the reader will be exposed to certain aspects of the OS and CPU opcode (x86-32-bit only). This article will show the workings of breakpoints and working of OutputDebugString (since we will be handling these two events only) used commonly while debugging, readers are urged to investigate conditional breakpoint and step wise execution (line by line) that are commonly supported by most debuggers. Run to cursor is similar to breakpoint.

Background
Before we start, reader will require basic knowledge of OS. Discussions related to OS is beyond the scope of this article, please feel free to refer other articles (or write to me) while reading this. Reader would be required to be exposed to commercially available debuggers (for this article: VS2010) and have debugged applications before using break points

Break Points
Breakpoint allows users to place a break in the flow of a program being debugged. The user may do this to evaluate certain conditions at that point in execution.
The debugger adds an instruction : int 3 (opcode : 0xcc) at the particular address (where break point is desired) in the process space of the executable being debugged. After this instruction is encountered:-
the EIP is moved to the interrupt service routine (in this case int 3),
The service routine will save the CPU registers (all Interrupt service routines must do this) ,signal the attached debugger, the program that called DebugActiveProcess(process ID of the exe being debugged) look up MSDN for this API.

The debugger will run a debug loop (mentioned in code as EnterDebugLoop() in file Debugger.cpp)
The signal from the service routine will trigger WaitForDebugEvent(&de, INFINITE), the debug loop (mentioned in the code as EnterDebugLoop) will loop through every debug signal encountered by WaitForDebugEvent. After processing the debug routine, the debugger will restore the instruction by replacing 0xcc (int 3) with the original instruction and return from the service routine by calling ContinueDebugEvent(de.dwProcessId, de.dwThreadId, DBG_CONTINUE). ( Before Placing the break point, the debugger must use ReadProcessMemory to get the original BYTE at that memory location).
when it returns from an interrupt service routine( using IRET) , EIP will point to the next byte to be executed, but we want it to point to the previous byte (the one we restored), this is done while handling the break point, use GetThreadContext to get value of ESP (this holds on the stack, the return address of EIP). Subtract one from the return address (get the return address by using ReadprocessMemory) and use WriteProcessMemory to update it, now EIP will be restored correctly (there are different ways to achieve this, VS2010 and other debuggers may use a different approach).

OutputDebugString
This API is used to display a string on the debug console, the user may use this to display certain state related information or trace.
when this is API is occured , OUTPUT_DEBUG_STRING_EVENT event is triggered.
An attached debugger will handle this event in the debug loop (mentioned in the code as EnterDebugLoop).
The event handling API will provide information of the string relative to the Debuggee's process space
use ReadProcessMemory to acquire the string (memory dump) from another process.
Using the code
The attached code must be referred to at all times while reading this article. The break point (opcode: 0xcc) is introduced by

BYTE p[]={0xcc}; //0xcc=int 3            // Any source code blocks look like this
::WriteProcessMemory(pi.hProcess,(void*)address_to_set_breakpoint, p, sizeof(p), &d);

Read more: Codeproject

Sunday, May 01, 2011

Why does this query consumes so much CPU?

Recently I worked with a customer who reported a slow running query.  Let me simplify this to illustrate the problem.

There are two tables  t1 (pk int identity primary key, c1 int, c2 int, c3 int, c4 varchar(50)) and  t2 (pk int identity primary key, c1 int, c2 int, c3 int, c4 varchar(50)).  Each table has about 10000 rows. 
But the following query is very slow.  
select  COUNT (*)  from t1 inner join t2 on t1.c1=t2.c1 and t1.c2=t2.c2 and t1.c3=t2.c3 and t1.c4<>t2.c4

This query runs over 30 seconds and consumes over 30 seconds of CPU.  The query actually returns 0 rows.  With two tables of size of 10,000 each, this seems to be unreasonable. 
When investigate CPU consumption by a query, we normally look at a few things.  First, we look at how many logical reads this query has done.  Secondly, we look at the plan to see how many rows are processed by each operator.
But when we track logical reads via profiler trace (reads column), we see very low logical reads (less than 60).   When we look at the plan, the number of rows processes are not that many either.   The partial execution plan is shown below.

5657.image_5F00_thumb_5F00_24499B2D.png

Memory Leak Detector including CallStack Info for x86/x64 c++

Project Description
i have rewrited this sources which were by David A. Jones to run in x64 and x86 mode.

Read more: Codeplex