Introduction
As Windows software developers, we all extensively use Visual Studio and/or WinDbg to step into our code, set breakpoints, watch variables, and perform many other useful tasks related to the debugging of applications. We somehow know that an internal mechanism exists in order to enable debuggers to map source code to binary and step into many of the available runtime libraries. For this purpose, debuggers use Program Database (PDB) files for managed as well as unmanaged code. PDB for managed code contains less debug information since these are located in the metadata section of the PE sections.
This article has several goals:
- Show the existence of PDB files and how debuggers use them.
- Show the existing technology used to retrieve their content.
- Give an idea about the importance of PDB files while debugging and the kind of information embedded in them.
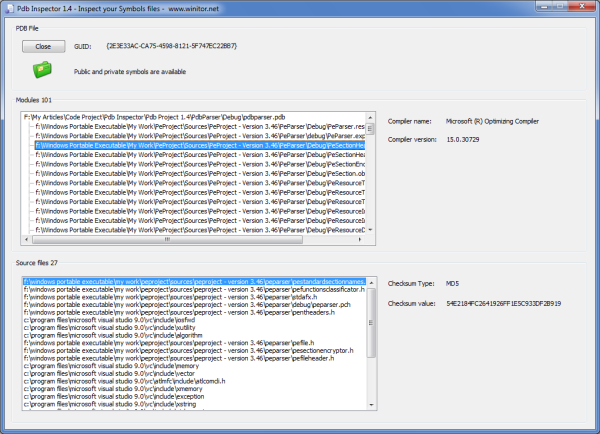
- Present a project that implements a comfortable C++ wrapper on top of the esoteric DIA classes as well as a PDB inspector front end. This is the first part of a series dedicated to PDB and their executables counterpart. This article concentrates on one aspect of these PDB files, namely the modules referenced.
Background
A native C++ PDB file contains a lot of information:
- public, private, and static function addresses
- Global variable names and addresses
- Parameter and local variable names and offsets where to find them on the stack
- Source file names and their lines, etc...
A .NET PDB file only contains two pieces of information:
- The source file names
- Their lines and the local variable names
All the other information is already in the .NET metadata so there is no need to duplicate the same information in a PDB file.
Read more: Codeproject
QR: 